Pick Path Optimization: Reduce Warehouse Walking Time by 40 Percent
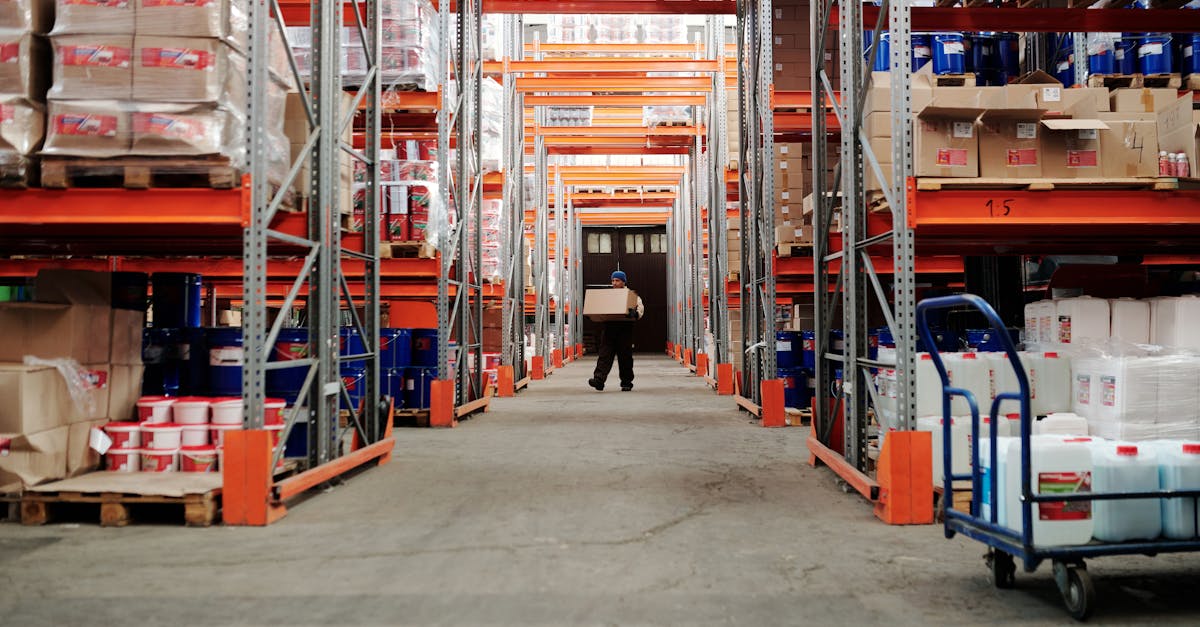
Your pickers are athletes whether they signed up for it or not. The average warehouse picker walks 8 to 12 miles per shift, and 60 to 70 percent of that shift is pure travel time, not actual picking. That means for every hour a picker is on the clock, roughly 40 minutes go to walking between locations and only 20 minutes go to pulling product off shelves.
Pick path optimization changes that ratio. By restructuring how pick lists are sequenced, where inventory is slotted, and how orders are grouped, you can cut walking distance by 30 to 40 percent. In a warehouse processing 20,000 order lines per week, that recovers the equivalent of 3 to 4 full-time workers without hiring anyone.
This guide covers the routing strategies, slotting principles, and batching methods that produce those results, along with the benchmarks you need to measure whether your changes are working.
Why Walking Time Is the Largest Hidden Cost in Fulfillment
Labor accounts for 55 to 65 percent of total warehouse operating cost, and the picking process alone represents the majority of that labor. When pickers spend most of their time walking instead of picking, you are paying for transit, not productivity.
"We switched to a dynamic pick path system in our 50k sq ft warehouse and cut walking time by 25 percent. Picks are batched by zone now. It changed throughput completely."
-- Warehouse operations manager, r/warehousing
The cost compounds in ways that are not immediately visible on a P&L statement. Excessive walking causes fatigue, and fatigued pickers make more errors. A study by Cisco-Eagle found that every additional mile walked per shift correlates with higher mis-pick rates in the second half of the day. Errors that slip past the pack station cost $15 to $25 each in return processing, re-shipping, and customer service time.
Here is what the walking-cost math looks like for a mid-size ecommerce operation:
- 5 pickers walking 10 miles per shift = 50 miles of total daily travel
- At an average walking speed of 3 mph, that is 16.7 labor hours per day spent walking
- At $18/hour fully loaded, walking alone costs $300 per day or $78,000 per year
- A 35 percent reduction in walking distance saves $27,300 annually in labor alone, before accounting for fewer errors and faster cycle times
Five Pick Path Routing Strategies Compared
The routing strategy determines the physical path a picker follows through the warehouse. Different strategies suit different layouts and order profiles. No single approach works for every operation, but understanding the tradeoffs lets you pick the right one for your setup.
| Strategy | How It Works | Best For | Walking Reduction vs. Random |
|---|---|---|---|
| S-Shape (Serpentine) | Picker enters each required aisle at one end and exits at the other, never backtracking | Small to mid-size warehouses with picks in most aisles | 20 to 30 percent |
| Return | Picker enters and exits each aisle from the same end, skipping aisles with no picks | Wide warehouses where picks are concentrated in a few aisles | 15 to 25 percent |
| Largest Gap | Picker enters the aisle, travels to the farthest pick, then returns, skipping the largest empty gap in the aisle | Warehouses with sparse picks per aisle | 25 to 35 percent |
| Mid-Point | Aisle is divided at the center. Picker enters from the nearest end and only travels to the midpoint before returning | Long aisles with picks clustered near the ends | 20 to 30 percent |
| Algorithmic (Optimal) | Software calculates the shortest total route across all pick locations using the facility map | Any layout, especially large or complex warehouses with a WMS | 30 to 40 percent |
"We tested S-shape against largest-gap in our 80k sq ft DC. Largest-gap won by 18 percent on average distance because our picks are spread unevenly across aisles. The strategy that works depends entirely on your pick density per aisle."
-- Distribution center supervisor, warehouse management forum
If you do not have a WMS that calculates optimal routes, start with S-shape for dense pick profiles (picks in most aisles) or largest-gap for sparse profiles (picks in fewer than half the aisles). Either strategy delivers meaningful results with nothing more than reordering your pick list by bin location.
Velocity Slotting: Put Fast Movers Where They Belong
Routing only controls the path through the warehouse. Slotting controls where products live on that path, and it has an equal or greater impact on total walking distance.
The principle is straightforward. The top 20 percent of SKUs by pick frequency generate roughly 80 percent of all picks. If those SKUs sit in bins closest to the pack station and at waist-to-shoulder height (the golden zone), the majority of picks happen within the shortest possible travel distance and with the least physical strain.
Here is how to implement velocity-based slotting in a single weekend:
- Export your pick history for the last 90 days and rank SKUs by total units picked
- Identify your top 20 percent of SKUs (the A-items in ABC analysis)
- Map your warehouse floor and identify the bins closest to the pack station at golden-zone height
- Relocate A-items into those prime bins, grouping SKUs that are frequently ordered together in adjacent slots
- Place B-items (the next 30 percent) in the surrounding area
- Push C-items (the remaining 50 percent that account for under 5 percent of picks) to the farthest aisles and highest/lowest shelves
"Implemented zone picking with optimized paths via slotting software. Pickers love it. Reduced steps per order from 1,200 to 700. Errors dropped 15 percent too."
-- Supply chain manager, r/supplychain
Review your slotting at least monthly. Seasonal shifts, new product launches, and promotional spikes all change velocity rankings. A SKU that was a C-item in February can become an A-item during a March sale. Operations that re-slot dynamically based on rolling 30-day velocity data maintain tighter travel distances year-round.
For a deeper look at how slotting integrates with the full pick-pack-ship workflow, see our pick-pack-ship optimization checklist.
Batching and Zone Picking: Consolidate Trips Across Orders
Routing and slotting optimize travel for a single pick run. Batching optimizes how many orders you handle per run, and the combination of these approaches is where the largest gains appear.
In discrete picking, each order gets its own warehouse walk. A picker handles one order at a time, walks the full path, returns to the pack station, and starts over. This works fine at 30 orders per day. At 300 orders per day, discrete picking creates enormous redundant travel because multiple orders share the same SKUs and the same aisle locations.
Batching solves this by grouping orders together so the picker visits each location once and pulls items for multiple orders simultaneously.
There are three common approaches:
- Batch picking groups 5 to 20 orders into a single walk. The picker uses a segmented cart or multi-tote system to separate items by order during the pick. Travel time per order drops 60 to 70 percent because aisle visits are shared across all orders in the batch. This method works well when orders average 1 to 3 lines and share SKU overlap.
- Zone picking assigns each picker to a fixed area of the warehouse. Orders move between zones on a conveyor or cart, accumulating items as they pass through each zone. Pickers become experts in their zone, which reduces search time and improves accuracy. Zone picking suits large warehouses (40,000+ sq ft) where a single picker would spend too much time traversing the full floor.
- Wave picking combines batching with timed release windows aligned to carrier cutoff times. Orders are grouped by priority, shipping method, or destination region and released in waves every 1 to 2 hours. This balances workload across the shift and ensures expedited orders get picked first.
Most operations above 200 orders per day benefit from a hybrid approach. Batch picking within zones, released in waves, delivers the cumulative savings of all three methods. Our guide on order batching for 10x fulfillment throughput covers the implementation details for each batching type.
Implementation: A 2-Week Rollout Plan
Pick path optimization does not require a WMS purchase or a warehouse redesign. The highest-impact changes can be implemented in two weeks using your existing tools and layout.
Week 1 focuses on data collection and quick wins:
- Day 1 to 2: Export 90 days of pick data. Rank SKUs by pick frequency. Map your current warehouse layout with bin locations.
- Day 3: Measure baseline metrics. Have each picker wear a pedometer for a full shift. Record average steps per pick, picks per hour, and order cycle time. You need at least 3 full days of baseline data before making changes.
- Day 4 to 5: Re-slot your top 50 SKUs into golden-zone bins closest to the pack station. This is the single highest-impact change and can be done over a weekend with 2 to 3 people.
Week 2 focuses on pick list optimization and batching:
- Day 8 to 9: Reorder pick lists by physical bin location (aisle, then bay, then shelf level) instead of the default order-entry sequence. If your system does not support automatic sequencing, manually sort the pick list export in a spreadsheet before printing.
- Day 10 to 11: Introduce batch picking for orders with 1 to 3 lines. Start with batches of 5 orders to let pickers adjust to the multi-order workflow, then scale to 10 to 15 orders per batch as accuracy stabilizes.
- Day 12 to 14: Measure post-implementation metrics using the same methodology as baseline. Compare steps per pick, picks per hour, and cycle time.
The expected results from this 2-week rollout, based on industry benchmarks and reported outcomes from warehouse teams:
| Metric | Typical Baseline | Post-Optimization Target | Improvement |
|---|---|---|---|
| Steps per pick | 80 to 120 | 50 to 75 | 30 to 40 percent |
| Picks per labor hour | 40 to 60 | 70 to 100 | 50 to 75 percent |
| Order cycle time (pick to pack) | 8 to 12 minutes | 4 to 7 minutes | 35 to 50 percent |
| Daily walking distance per picker | 10 to 12 miles | 6 to 8 miles | 30 to 40 percent |
| Mis-pick rate | 1 in 200 lines | 1 in 400 lines | 50 percent |
Accuracy improvements are a side effect of reduced fatigue. Pickers who walk less are more alert during the second half of their shift, which is when most errors occur. For a framework on building error-prevention checkpoints into your pick process, see our warehouse error-proofing SOP guide.
Measuring and Sustaining Results
Optimization is not a one-time project. SKU velocity changes with seasons, promotions, and new product launches. A pick path that was optimal in January may be 20 percent less efficient by April if you have not re-evaluated slotting.
Build these measurement habits into your weekly operations review:
- Track picks per labor hour by shift and by picker. Look for outliers in both directions. A picker consistently outperforming the average may have discovered a routing shortcut worth standardizing. A picker consistently underperforming may need re-training or may be assigned to a poorly slotted zone.
- Review your SKU velocity ranking monthly. Any SKU that has moved more than 10 positions in the ranking is a candidate for re-slotting.
- Monitor order cycle time (pick assignment to pack-station arrival) as your primary throughput indicator. Walking distance is a leading metric, but cycle time is the one that directly affects customer-facing delivery promises.
- Audit pick list sequencing weekly for the first month. Verify that lists are sorted by bin location and that the routing strategy (S-shape, largest-gap, or algorithmic) is being followed by pickers on the floor.
The operations that sustain 30 to 40 percent walking reductions over time are the ones that treat pick path optimization as a recurring process, not a one-time fix. Set a monthly calendar reminder to review velocity data, re-slot the top movers, and recalibrate batch sizes based on current order volume.
According to research published by the Material Handling Institute (MHI), warehouses that review slotting quarterly maintain 85 to 90 percent of their initial optimization gains over 12 months, while those that set and forget lose half the gains within 6 months as product mix shifts. The Warehousing Education and Research Council (WERC) annual benchmarking survey reports that top-quartile operations average 90+ picks per labor hour, a number that is only achievable with active path and slotting management.
Pick path optimization is one of the few warehouse improvements that costs almost nothing to implement and pays for itself within the first week. The walking time is already being paid for. The only question is whether that time is spent on travel or on productive picks.
Frequently Asked Questions
Most operations see a 27 to 40 percent reduction in walking distance after implementing pick path optimization. The savings come from three layers: sequencing pick lists by physical bin location (15 to 25 percent alone), velocity-based slotting to place fast movers near pack stations (another 10 to 15 percent), and batch or zone picking to consolidate aisle trips across multiple orders. A 50,000 square foot warehouse processing 500 orders per day can recover the equivalent of 3 to 4 full-time workers through reduced travel alone.
The S-shape (serpentine) strategy works well for small to mid-size warehouses because pickers traverse each required aisle end to end with no backtracking. The largest-gap strategy outperforms S-shape in warehouses where picks are spread unevenly, because pickers skip empty sections of an aisle rather than walking the full length. For operations with a WMS capable of real-time path calculation, algorithmic routing that evaluates all pick locations against a facility map and selects the shortest total route delivers the highest savings, typically 30 to 40 percent less travel than unoptimized discrete picking.
Slotting determines where each SKU lives in the warehouse, and it has a direct effect on how far pickers walk. The 80/20 rule applies: the top 20 percent of SKUs by pick frequency typically account for 80 percent of total picks. Placing those fast movers in the golden zone (waist to shoulder height, closest aisles to the pack station) means the majority of picks happen within the shortest possible travel distance. Operations that re-slot based on velocity data report 15 to 20 percent reduction in average pick travel within the first week.
Yes. Start by sequencing your pick lists by physical bin location instead of the order in which items appear on the sales order. This alone cuts 15 to 25 percent of unnecessary backtracking. Next, slot your top 50 SKUs by pick frequency into the closest bins to your pack station. These two changes require no software investment and can be implemented over a single weekend. A WMS adds algorithmic routing and real-time batch optimization on top, but the manual foundation still delivers meaningful savings.
Track three metrics before and after: average distance per pick (measured in steps or meters using a pedometer or warehouse floor grid), picks per labor hour, and order cycle time from pick assignment to pack-station arrival. Measure a full week of baseline data before making changes, then compare the same metrics over the first two weeks post-implementation. A successful optimization shows lower distance per pick, higher picks per hour, and shorter cycle time. If distance drops but picks per hour stays flat, the bottleneck has shifted to another process stage like sorting or packing.
Related Articles
View all
The Merchant Watchlist: 21 Signals to Track Before They Hit Your Margins
Most ecommerce sellers react after costs move. This watchlist shows what merchants should track weekly across freight, tariffs, fuel, suppliers, platforms, demand, and cash.
Amazon Delivery Is Now Measured in Minutes. Can Small Stores Compete?
Amazon is pushing delivery from days to hours to minutes. Small ecommerce brands cannot copy that network, but they can compete with clarity, trust, and smarter promises.

Unified Commerce Is the New Omnichannel, and Most Brands Are Still Behind
Omnichannel is no longer enough if every system still runs in silos. Unified commerce is becoming the operating standard for modern ecommerce.